Memilih pengumpul debu siklon hanya berdasarkan “persentase efisiensi” tunggal merupakan kesalahan yang umum terjadi dan berakibat mahal. Bagi para profesional yang menangani debu di lapangan—campuran kompleks dari berbagai ukuran dan kepadatan partikel—penyederhanaan berlebihan ini dapat menyebabkan kinerja sistem yang kurang optimal, pemeliharaan yang berlebihan, serta kerusakan pada filter hilir. Metrik yang paling penting bukanlah nilai rata-rata; melainkan kesesuaian yang tepat antara distribusi ukuran partikel debu Anda dan kurva efisiensi siklon berdasarkan kelasnya.
Perhitungan yang akurat kini menjadi persyaratan yang tidak dapat ditawar-tawar. Tekanan regulasi dan model total biaya kepemilikan menuntut kinerja yang dapat diprediksi. Kesalahan perhitungan dapat mengakibatkan kegagalan dalam uji emisi atau dikenakannya sanksi operasional yang signifikan. Panduan ini menyajikan metodologi teknik untuk beralih dari pendekatan berdasarkan perkiraan ke pemilihan berbasis data, sehingga memastikan sistem Anda memenuhi target kinerja dan ekonomi.
Memahami Kurva Efisiensi Tingkat Siklon
Kurva sebagai Cetak Biru Kinerja
Kinerja siklon ditentukan oleh kurva efisiensi berdasarkan ukuran, yaitu grafik yang menggambarkan probabilitas penangkapan terhadap ukuran partikel. Hal ini menunjukkan bahwa efisiensi pada dasarnya bergantung pada ukuran. Partikel yang lebih besar lebih mudah ditangkap daripada partikel halus karena mekanisme pemisahan sentrifugal. Implikasi strategisnya jelas: analisis kinerja harus beralih dari efisiensi rata-rata ke kurva yang spesifik berdasarkan ukuran partikel.
Menentukan Batas Kinerja: d50
Diameter batas yang dihitung (d50) menjadi acuan kurva efisiensi klasifikasi. Diameter ini mewakili ukuran partikel yang tertangkap dengan efisiensi 50%. Parameter tunggal ini membentuk batas kinerja yang pasti. Efisiensi penangkapan untuk setiap partikel merupakan fungsi yang dapat diprediksi dari rasionya terhadap d50, yang diatur oleh eksponen empiris Γ (biasanya 2–4). Hubungan ini berarti perubahan kecil pada d50 berdampak secara eksponensial terhadap penangkapan partikel halus. Dalam analisis data vendor yang kami lakukan, penurunan d50 sebesar 10% dapat meningkatkan penangkapan partikel di bawah 10 µm lebih dari 30%, sehingga menjadikan kurva efisiensi sebagai alat yang esensial untuk evaluasi yang rasional.
Parameter Desain Utama yang Menentukan Ukuran Potongan (d50)
Persamaan Keseimbangan Gaya
Ukuran potongan (d50) dihitung berdasarkan keseimbangan gaya antara gaya sentrifugal ke luar dan gaya hambatan ke dalam. Rumus yang umum digunakan adalah: d50 = √[(9 * μ * Q) / (π * ρp * vθi² * (Hc – Sc))]. Variabel-variabel utama adalah viskositas gas (μ), laju aliran (Q), dan kepadatan partikel (ρp), dan kecepatan gas internal (vθi). Kecepatan dan dimensi tersebut ditentukan oleh geometri siklon.
Geometri sebagai Landasan yang Tak Dapat Ditawar-tawar
Efisiensi secara intrinsik terkait dengan rasio geometris tetap yang telah ditetapkan melalui penelitian. Rasio-rasio ini—untuk dimensi saluran masuk, diameter penemu pusaran, dan panjang badan—terterapkan dalam desain standar seperti Stairmand atau Lapple. Penyimpangan dari proporsi yang telah teruji ini berisiko menyebabkan penurunan kinerja yang signifikan dan membuat model prediktif dasar menjadi tidak valid. Organisasi harus memperlakukan rasio-rasio ini sebagai batasan desain untuk memastikan kinerja dasar yang andal.
Tabel berikut merangkum bagaimana parameter-parameter utama memengaruhi ukuran potongan kritis.
Bagaimana Parameter Mempengaruhi Pemisahan
| Parameter | Simbol | Pengaruh terhadap Ukuran Potongan (d50) |
|---|---|---|
| Kepadatan Partikel | ρ_p | Berbanding terbalik |
| Laju Aliran | Q | Berbanding lurus |
| Viskositas Gas | μ | Berbanding lurus |
| Kecepatan Masuk | v_θi | Berbanding terbalik |
| Tinggi Siklon | Hc | Berbanding terbalik |
Sumber: Dokumentasi teknis dan spesifikasi industri.
Cara Menghitung Efisiensi Keseluruhan untuk Campuran Debu Anda
Perhitungan Rata-rata Tertimbang
Untuk debu polidisperse, efisiensi pengumpulan secara keseluruhan merupakan rata-rata tertimbang dari seluruh distribusi ukuran partikel (PSD). Perhitungan ini memerlukan diskritisasi PSD menjadi beberapa interval, masing-masing dengan diameter representatif (di) dan fraksi massa (xi). Efisiensi derajat (ηi) untuk setiap interval dihitung menggunakan ηi = 1 / [1 + (d50 / di)^Γ]. Efisiensi keseluruhan adalah ηtotal = Σ (xi * ηi).
Hukum Pengembalian yang Semakin Menurun
Kerangka kerja matematis ini mengungkap wawasan strategis yang krusial: peningkatan efisiensi menurun secara eksponensial saat mendekati 100%. Sebuah siklon dengan efisiensi 98% membiarkan debu lolos dua kali lipat lebih banyak daripada unit dengan efisiensi 99%. Unit dengan efisiensi 90% menyaring 100 kali lebih banyak debu daripada unit dengan efisiensi 99,9%. Hubungan nonlinier ini membuat peningkatan bertahap pada rentang efisiensi tinggi menjadi sangat berharga untuk melindungi filter hilir. Nilai η_total yang dihitung, yang diperoleh dari PSD spesifik Anda, merupakan metrik esensial untuk membandingkan desain.
Tabel di bawah ini menggambarkan bagaimana ukuran partikel relatif terhadap d50 menentukan kontribusinya terhadap hasil akhir.
Dari Ukuran Partikel hingga Kinerja Secara Keseluruhan
| Ukuran Partikel vs. d50 | Efisiensi Tingkat (η_i) | Kontribusi terhadap η_total |
|---|---|---|
| d_i >> d50 (Besar) | Pendekatan 100% | Penangkapan bermassa tinggi |
| d_i = d50 | Exactly 50% | Baseline performance |
| d_i << d50 (Fine) | Approaches 0% | Low mass capture |
| Overall Result | ηtotal = Σ (xi * η_i) | Weighted average |
Catatan: The exponent Γ in the grade efficiency formula is typically 2-4.
Sumber: Dokumentasi teknis dan spesifikasi industri.
Critical Factors: PSD, Density, Flow Rate & Geometry
The Dominant Performance Quartet
Four factors dominate cyclone performance calculation. The Particle Size Distribution (PSD) is paramount; a dust rich in particles above d50 yields high overall efficiency. Particle density (ρ_p) directly influences d50; lower-density materials like wood flour are harder to collect than metal oxides of the same size. Flow rate is the primary operational lever. Testing shows efficiency for fines is highly sensitive to system flow rate, with lower flows causing significant bypass.
Managing Inherent Trade-offs
System design must maintain minimum operational flow rates to avoid catastrophic performance loss in fine dust applications. Geometry sets the stage, as previously emphasized. Together, these factors create inherent trade-offs, most notably between pressure drop and efficiency. Higher inlet velocities improve centrifugal force but increase energy costs, requiring an economic optimization between separation performance and lifetime operational expenditure.
The interplay of these factors is summarized below.
Factor Interactions and Trade-offs
| Faktor | Primary Influence | Operational Trade-off |
|---|---|---|
| Particle Size Distribution (PSD) | Overall efficiency result | None; an input parameter |
| Particle Density (ρ_p) | Cut size (d50) | Lower density = harder collection |
| Laju Aliran Sistem (Q) | Efisiensi partikel halus | Lower flow = catastrophic bypass |
| Geometry & Inlet Velocity | Gaya sentrifugal | Higher velocity = higher pressure drop |
Sumber: Dokumentasi teknis dan spesifikasi industri.
Limitations of Theoretical Models vs. Real-World Performance
The 40% Risk Margin
While essential for preliminary sizing, theoretical models carry significant risk margins. Published design models are explicitly flagged as having error margins up to 40% versus experimental results. Their validity is limited to standard geometries, tangential inlets, and moderate dust loads (< ~10 g/m³). They assume spherical, non-interacting particles and ideal flow patterns.
When Models Break Down
These assumptions make models less accurate for very fine particles (<5µm), sticky materials, or atypical operating conditions. The strategic implication is that using these models for final design constitutes high-risk technical debt. For a definitive design, detailed engineering requires proprietary vendor codes or physical testing. This reality segments the market into performance-tiered ecosystems, from DIY models to engineered commercial units.
The table clarifies the gap between model assumptions and operational reality.
Assumption vs. Reality in Prediction
| Model Assumption | Real-World Deviation | Impact on Prediction |
|---|---|---|
| Standard geometry, tangential inlet | Non-standard designs | Invalidates core calculations |
| Spherical, non-interacting particles | Sticky, agglomerating dust | Reduced accuracy |
| Moderate dust loads (<10 g/m³) | High dust loading | Altered flow patterns |
| Ideal flow patterns | Real vortex instability | Significant fine particle error |
| Reported Error Margin | Up to 40% vs. experimental | High-risk for final design |
Sumber: Dokumentasi teknis dan spesifikasi industri.
Comparing Standard Cyclone Designs (Stairmand vs. Lapple)
Optimized for Different Goals
Standard designs like Stairmand (high-efficiency) and Lapple (high-throughput) represent optimized sets of geometric ratios. The Stairmand design typically features a longer conical section and different inlet/outlet proportions to generate a tighter vortex for finer d50, prioritizing collection performance. The Lapple design, often with a larger vortex finder, may sacrifice some fine-particle efficiency for lower pressure drop and higher gas handling capacity.
The Efficiency-Pressure Drop Balance
Choosing between them involves balancing the efficiency-pressure drop trade-off. This comparison is only meaningful because both adhere to standard geometric principles. As the market segments into tiers, these engineered designs occupy a space above DIY units, offering validated performance within their respective design philosophies, but still subject to the limitations of pre-design models.
Key differences between these benchmark designs are outlined below.
Design Philosophy and Outcome
| Design Characteristic | Stairmand (High-Efficiency) | Lapple (High-Throughput) |
|---|---|---|
| Primary Design Goal | Maximum particle collection | Higher gas capacity |
| Fine Particle Performance | Finer cut size (d50) | Coarser cut size |
| Penurunan Tekanan | Typically higher | Typically lower |
| Conical Section | Longer | Lebih pendek |
| Diameter Pencari Pusaran | Smaller proportions | Larger proportions |
Sumber: Dokumentasi teknis dan spesifikasi industri.
Implementing Calculations: Software, Spreadsheets & Best Practices
The Iterative Calculation Process
Implementing the multi-step calculation for d50 and overall efficiency is iterative. The process involves determining all geometrical dimensions from standard ratios, calculating internal velocities, and finally computing the cut size. This is best handled with specialized software or validated spreadsheets to avoid manual error.
Foundational Data and Validation
A critical best practice is to begin with an accurate PSD of the actual dust—a calculation is meaningless without it. Furthermore, validation methodology directly determines perceived product value. Rigorous testing protocols (controlled flow, virgin dust, precise scales) expose true performance differences obscured by casual reviews. Practitioners should seek performance data derived from stringent standards like ISO 16890-4: 2017 for filter evaluation or ASHRAE 52.2-2017 for particle removal efficiency. This highlights that cyclones are evolving from standalone units to integrated system nodes; calculations must consider their role as pre-filters within a broader, digitally monitored system.
Selecting and Validating a Cyclone for Your Specific Application
Matching Curve to PSD
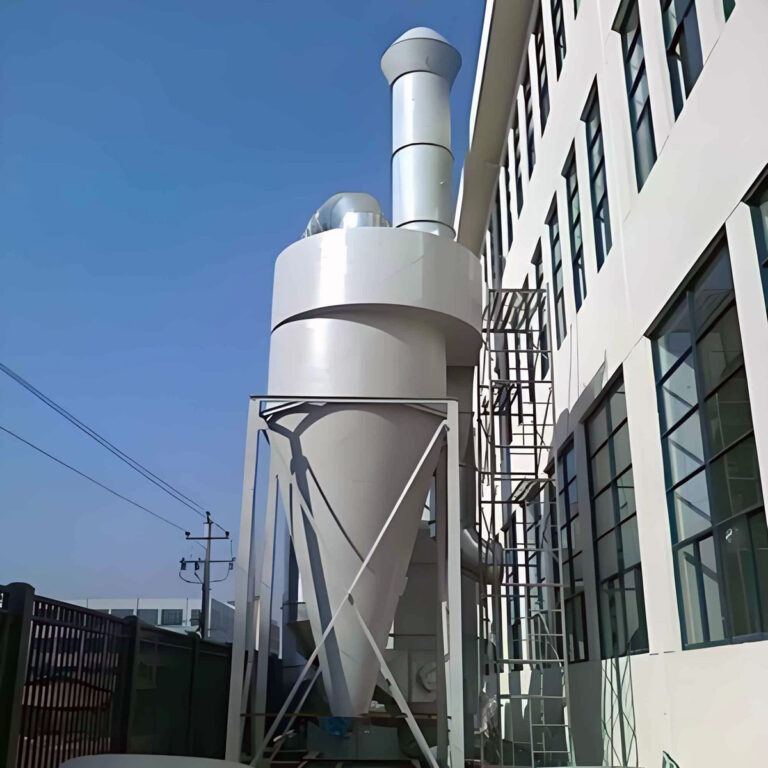
Selection begins with matching the cyclone’s predicted grade efficiency curve to your dust’s PSD and required overall efficiency target. Consider particle density, operational flow rate stability, and acceptable pressure drop. Remember that theoretical calculations are for estimation; final selection for critical applications requires consultation with experienced engineers. This step mitigates the 40% performance risk inherent in models. For complex mixtures, exploring advanced cyclone dust collector systems designed for mixed distributions is often necessary.
The Operational Reality Check
Crucially, operational neglect can transform a well-selected cyclone from an asset to a liability. Warnings about seal leaks, bucket implosion, and clogging illustrate that improper operation or maintenance can nullify efficiency gains and create safety hazards. Realized ROI depends equally on equipment selection and investment in operator training and preventive maintenance protocols, making deployment a process management challenge. Understanding legacy standards like EN 779:2012 can also be relevant when evaluating or upgrading existing system components.
Accurate cyclone selection is not about finding a single efficiency number but engineering a system where the grade efficiency curve intersects your dust’s PSD at the required performance point. This requires disciplined calculation, acknowledgment of model limitations, and a clear understanding of operational trade-offs between pressure drop, flow, and collection.
Need professional support in modeling your specific dust mix and validating cyclone performance? The engineering team at PORVOO specializes in translating complex particle data into reliable, efficient system designs. Contact us to discuss your application requirements and move from theoretical calculation to guaranteed performance.
Pertanyaan yang Sering Diajukan
Q: How do you calculate overall collection efficiency for a cyclone handling a real dust mixture?
A: You calculate it by performing a weighted average across your specific particle size distribution. Discretize the PSD into intervals, determine the grade efficiency for each using the cyclone’s d50 and exponent Γ, then sum the products of each interval’s mass fraction and its calculated efficiency. This reveals that improving from 98% to 99% efficiency halves the dust emitted, a critical factor for protecting downstream filters. This means facilities targeting high-purity exhaust or protecting sensitive equipment must prioritize designs that excel in the high-efficiency bands of their specific PSD.
Q: What are the practical limitations of using theoretical models for cyclone selection?
A: Theoretical models carry significant risk, with documented deviations up to 40% from actual performance. They assume ideal conditions like spherical particles, moderate dust loading, and standard geometries, making them unreliable for fine particles (<5µm), sticky materials, or non-standard designs. Their primary value is in preliminary sizing and comparative analysis. For projects where emission compliance or downstream protection is critical, plan for vendor-specific engineering analysis or physical testing with your actual dust to mitigate this pre-design risk before final procurement.
Q: How does particle density impact cyclone selection for different industrial materials?
A: Particle density directly influences the cut size (d50); lower-density materials like wood flour or polymers require more centrifugal force for collection than metal oxides of the same size. This is because the separation force depends on the density difference between the particle and the carrier gas. If your operation processes low-density powders, you should prioritize high-efficiency cyclone designs or be prepared to operate at higher flow rates to achieve the necessary separation performance for your target efficiency.
Q: Which standard test methods are relevant for evaluating the filtration performance of a dust collection system?
A: System performance evaluation should reference ASHRAE 52.2-2017 for determining particle size removal efficiency (MERV) and ISO 16890-1 for filter rating based on PM1, PM2.5, and PM10 capture. The legacy EN 779:2012 standard is also useful for historical data comparison. This means your validation methodology should specify which standard was used to ensure performance data is comparable and meets your facility’s air quality or regulatory targets.
Q: Why is maintaining a minimum operational flow rate critical for cyclone performance?
A: Collection efficiency for fine particles is highly sensitive to system flow rate, with lower flows leading to significant performance bypass and a larger effective d50. The centrifugal force driving separation is a function of the internal gas velocity, which drops with reduced flow. For applications with a high fraction of fine dust, you must design the system to maintain this minimum flow at all operational states to avoid catastrophic efficiency loss and potential downstream filter overload.
Q: How should we approach the trade-off between efficiency and pressure drop when comparing cyclone designs?
A: This trade-off is fundamental; designs like Stairmand (high-efficiency) and Lapple (high-throughput) represent optimized points on this curve. Higher inlet velocities improve centrifugal force and cut size but increase pressure drop and lifetime energy costs. If your primary goal is minimizing particulate emissions, expect higher operational expenditure. Conversely, if energy costs dominate or you have a robust downstream filter, a higher-throughput design with a slightly larger d50 may offer a better total cost of ownership.
Q: What is the single most important data input for accurately selecting a cyclone?
A: An accurate particle size distribution (PSD) of your actual process dust is paramount. Without it, any calculation of d50 or overall efficiency is speculative. The PSD determines what fraction of your dust lies above or below the cyclone’s cut size, directly governing the weighted overall efficiency. Before engaging in detailed modeling or vendor discussions, you should invest in representative dust sampling and PSD analysis to establish a reliable performance baseline for selection.